Impending Outbreaks
Table of contents
Anticipating Outbreaks
This exploration is focused on "anticipating outbreaks via running percentage changes" of "cumulative observations per $\mathbf{\small{100K}}$ people" w.r.t.with respect to a set of time periods. Why such an approach? Foremost, a mathematical outline which will make it easier to understand the discussion herein.
Let
wherein
| Description | |
|---|---|
| $\tau$ | Date |
| $\theta$ | Observations; $\theta$ is either deaths, positives, tests, or hospitalizations |
| $\theta_{\tau}$ | The number of observations by date $\tau$ |
| $\mathcal{P}$ | The population of the area in question |
Then a percentage change on date $\:\tau\:$ w.r.t. $\:\Delta\:$ days ago is
noting that
| Description | |
|---|---|
| $\Delta$ | Days |
| $C_{\tau - \Delta}$ | The cumulative [observations per 100K] value on date $\tau - \Delta$ |
Now, consider the graph of curves below. Each point on the 14 days curve, for example, is the percentage change relative to 14 days ago; the same logic applies to other "days ago", each having its own curve.
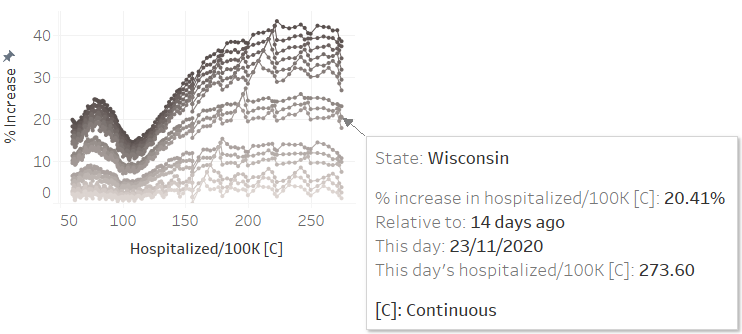
It is the accumulative behaviour of these curves that is of interest due to the following observations/hypotheses
- A divergence point, i.e., an x-axis point from whence curves start diverging, is probably a warning of an impending outbreak. And the probability of the outbreak occurring increases if there weren't any mitigating measures [coincidentally] in place around the same time.
- Converging curves that are approaching zero suggests an improving state of affairs.
- A divergence point is probably a warning that there might be a substantial increase in required hospitalizations. Such a point should set off a contingency planning alert.
Graphs
More will be written about percentage change curves in future. Meanwhile, the links below lead to a few graphs. Note, the most consistently available data sets are the tests, positives, and deaths data sets.